If the long-term average real return from the stock market is 7%, does that mean one can safely use a 7% withdrawal rate from a 100% stocks portfolio without worrying about running out of wealth or even dipping into the original principal? The answer is No. But answering yes is a common mistake; one which William Bengen set out to dispel.
Stocks do not earn their average real return each year. Some years they go up, and some years they go down. For a retiree who is withdrawing from their savings, the sequence of returns matters. If the market value of one’s assets falls in the early retirement period, then withdrawals will dig a further hole. Climbing out of this hole becomes increasingly difficult even if a subsequent recovery arrives. This is the sequence of returns risk.
William Bengen’s seminal study in the October 1994 Journal of Financial Planning, “Determining Withdrawal Rates Using Historical Data,” helped usher in the modern area of retirement withdrawal rate research by codifying the importance of sequence of returns risk. The problem he set up is simple: a new retiree makes plans for withdrawing some inflation-adjusted amount from their savings at the end of each year for a 30-year retirement period. What is the highest withdrawal amount as a percentage of retirement date assets that with inflation adjustments will be sustainable for the full 30 years?
To answer this question, he obtained a copy of Ibbotson Associates’ Stocks, Bonds, Bills, and Inflation yearbook, which provides monthly data for a variety of U.S. asset classes and inflation since January 1926. He decided to investigate using the S&P 500 index to represent the stock market and intermediate-term government bonds to represent the bond market.
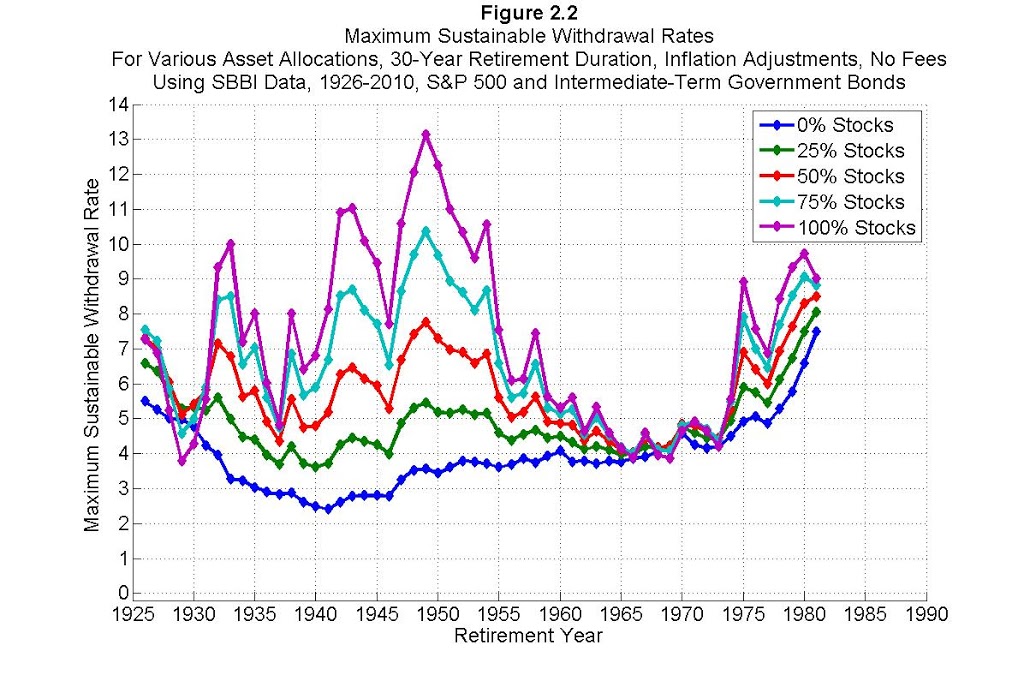
His exceedingly clever trick was to construct rolling 30-year periods from this data. He could consider a retirement lasting from 1926 through 1955, then 1927 through 1956, and so on. This technique is called ‘historical simulations.’ For each rolling historical period, he could calculate the maximum sustainable withdrawal rate. Though he did not produce the following illustration for his article, what he would have been looking at in his spreadsheet is something like this:
To bring greater realism to the discussion of safe withdrawal rates in retirement, he then focused his attention on what he called the SAFEMAX. It is simply the highest sustainable withdrawal rate for the worst-case retirement scenario in the historical period. With a 50/50 allocation for stocks and bonds, the SAFEMAX was 4.15%, and it occurred in 1966. That is the impact of sequence of returns risk. 4% turned out to be a much more realistic number than 7%. It was from these humble origins that the world of financial planning received the 4% rule.
[Note: I am following the same assumptions as in Mr. Bengen’s original research, except that I deduct withdrawals at the start of each year rather than the end of each year. I do think this is more realistic, and since it results in less time for assets to grow, withdrawal rates are slightly less with this assumption. My SAFEMAX is 4.04%.]
One other important issue coming out of William Bengen’s original study is asset allocation. In particular, Mr. Bengen recommended that retirees maintain a stock allocation of 50-75%. More specifically, he wrote, “I think it is appropriate to advise the client to accept a stock allocation as close to 75 percent as possible, and in no cases less than 50 percent.”
I will have a lot more to say about asset allocation (as well as about the 4% rule), and this stock allocation does sound rather high with respect to what we usually hear is reasonable for retirees. It is particularly poisonous to the ears of advocates of a safety-first retirement planning approach such as Zvi Bodie. But for now, let’s understand from where the 50-75% stock allocation recommendation comes.
One starting point to think about this is to consider Figure 2.2, which shows the time path of maximum sustainable withdrawal rates for different asset allocations. It’s hard to see exactly what is going on in the 1960s, but the general idea is that higher stock allocations tended to support higher withdrawal rates with little in the way of downside risk. I mean, the SAFEMAX does not appear to be that much lower with higher stock allocations.
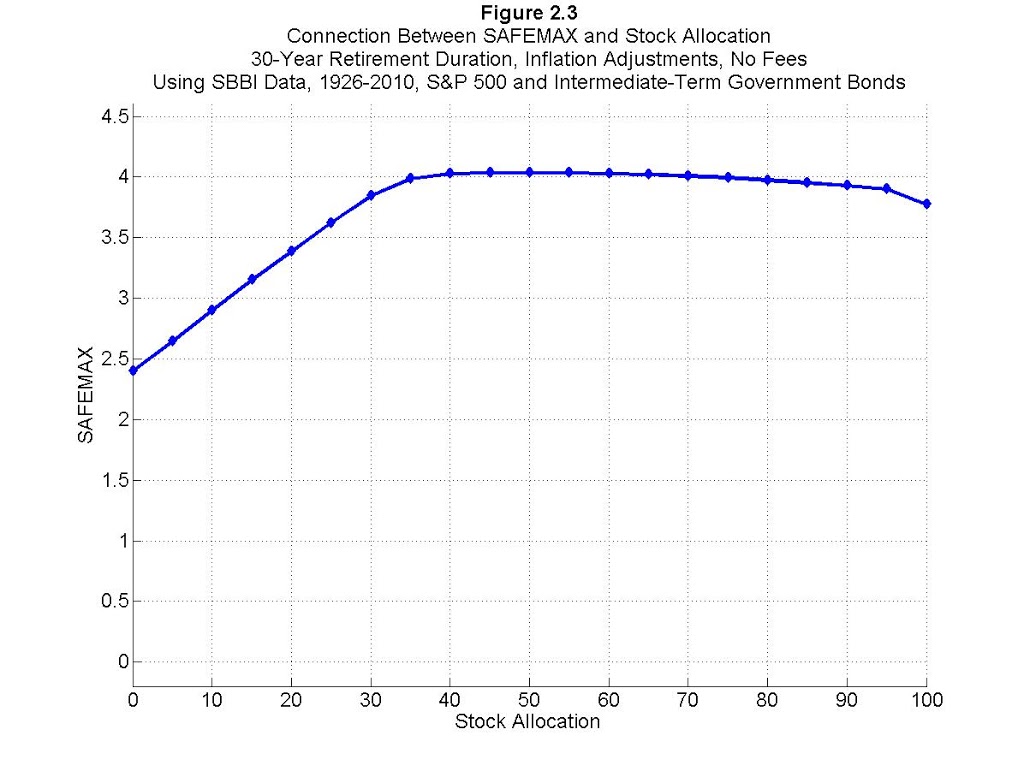
This point can be seen more clearly in Figure 2.3, which shows the SAFEMAX across the range of stock allocations. Low stock allocations resulted in lower SAFEMAXs, with an all-bonds portfolio even falling below a 2.5% SAFEMAX, but there appears to be a sweet spot between about 35% stocks and 80% stocks in which higher stock allocations have no discernable impact on the SAFEMAX. A 4% withdrawal rate tended to work no matter what stock allocation is chosen in this range. On the downside, retirees would have been just as well off with 80% stocks as with 35% stocks.
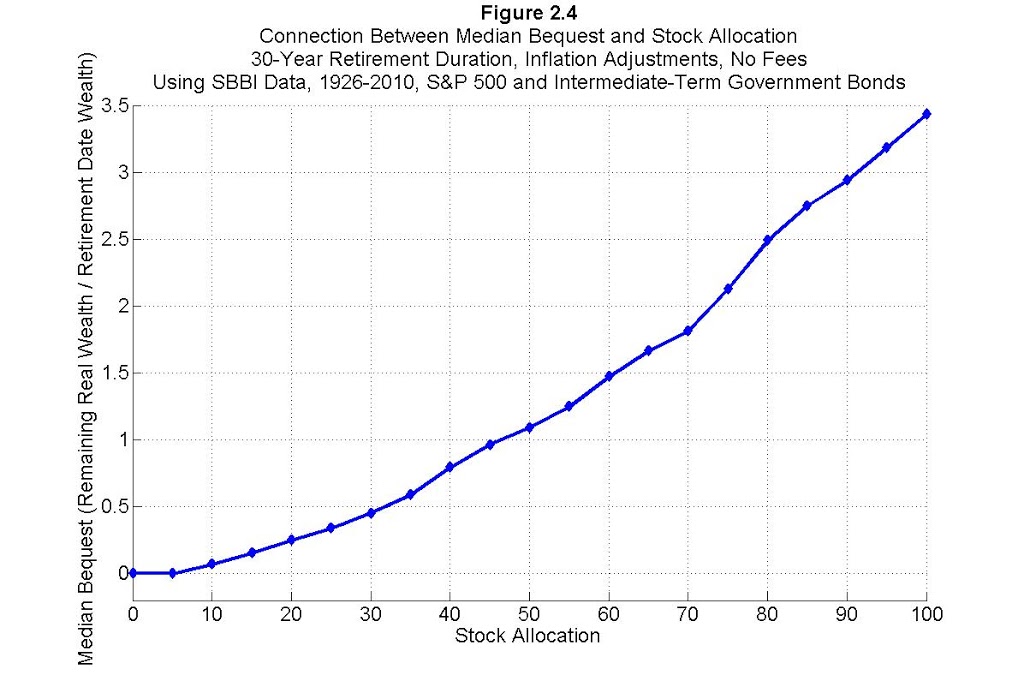
So why then did William Bengen recommend 50-75% stocks? The answer lies in Figure 2.4, which shows the median remaining realwealth after 30 years as a multiple of retirement date wealth. In this figure, we can see a general upward trajectory in remaining wealth as the stock allocation increases. In the average case, retirees using at least 45% stocks would have found that their entire initial principal had remained intact, even after adjusting with inflation! And with higher stock allocations, wealth tended to continue to grow more and more in the average case. So while Figure 2.3 showed that there was little in the way of downside with higher stock allocations, Figure 2.4 shows that there was a whole lot of upside available with higher stock allocations. This is the source of Mr. Bengen’s recommendation.
Finally, one other way to look at this is found in Figure 2.5. For different stock allocations, I plot not only the SAFEMAX, but also the median sustainable withdrawal rate and the best-case scenario sustainable withdrawal rate. This is another way to see the same point: with higher stock allocations, sustainable withdrawal rates tended to rise, but even the worst-case scenario held their ground even with a more volatile stock allocation.
McLean Asset Management Corporation (MAMC) is a SEC registered investment adviser. The content of this publication reflects the views of McLean Asset Management Corporation (MAMC) and sources deemed by MAMC to be reliable. There are many different interpretations of investment statistics and many different ideas about how to best use them. Past performance is not indicative of future performance. The information provided is for educational purposes only and does not constitute an offer to sell or a solicitation of an offer to buy or sell securities. There are no warranties, expressed or implied, as to accuracy, completeness, or results obtained from any information on this presentation. Indexes are not available for direct investment. All investments involve risk.
The information throughout this presentation, whether stock quotes, charts, articles, or any other statements regarding market or other financial information, is obtained from sources which we, and our suppliers believe to be reliable, but we do not warrant or guarantee the timeliness or accuracy of this information. Neither our information providers nor we shall be liable for any errors or inaccuracies, regardless of cause, or the lack of timeliness of, or for any delay or interruption in the transmission there of to the user. MAMC only transacts business in states where it is properly registered, or excluded or exempted from registration requirements. It does not provide tax, legal, or accounting advice. The information contained in this presentation does not take into account your particular investment objectives, financial situation, or needs, and you should, in considering this material, discuss your individual circumstances with professionals in those areas before making any decisions.