What Is The ‘Retirement Spending Smile’?

Many people approach retirement planning as if they’ll monotonically spend the same amount year after year throughout their retirement. This assumption certainly makes the planning process significantly simpler, but it’s not realistic. Our spending desires (and needs) change over time.
Many people want to take advantage of their early retirement while they are still spry and energetic enough to travel or make up for lost time on their (expensive) hobbies that they put to the side before retirement. As we get older, we tend to slow down and get more sedentary. This often translates to a decreased desire to spend. And then, towards the end of our lives there are a number of medical expenses that we will likely need to contend with.
David Blanchett’s 2014 article, “Exploring the Retirement Consumption Puzzle,” puts some data behind this consumption pattern by looking at household survey data to track their inflation-adjusted spending through time.
Blanchett observes a “retirement spending smile” that varies slightly for retirees with different household spending levels. The following exhibit provides Blanchett’s spending smile for a retiree that begins retirement with expenditures of $100,000.
On average, this household can expect to experience declining real expenditures through age eighty-four, when real spending reaches a trough of $74,146. This reflects a nearly 26% drop in real expenditures.
After this point, average real expenditures increase, though they do not necessarily exceed their initial retirement levels until retirees reach their mid-nineties. I produced these calculations using Blanchett’s own equation, which relates changes in annual retirement spending to age and the expenditure target at the start of retirement.
Blanchett’s Retirement Spending Smile
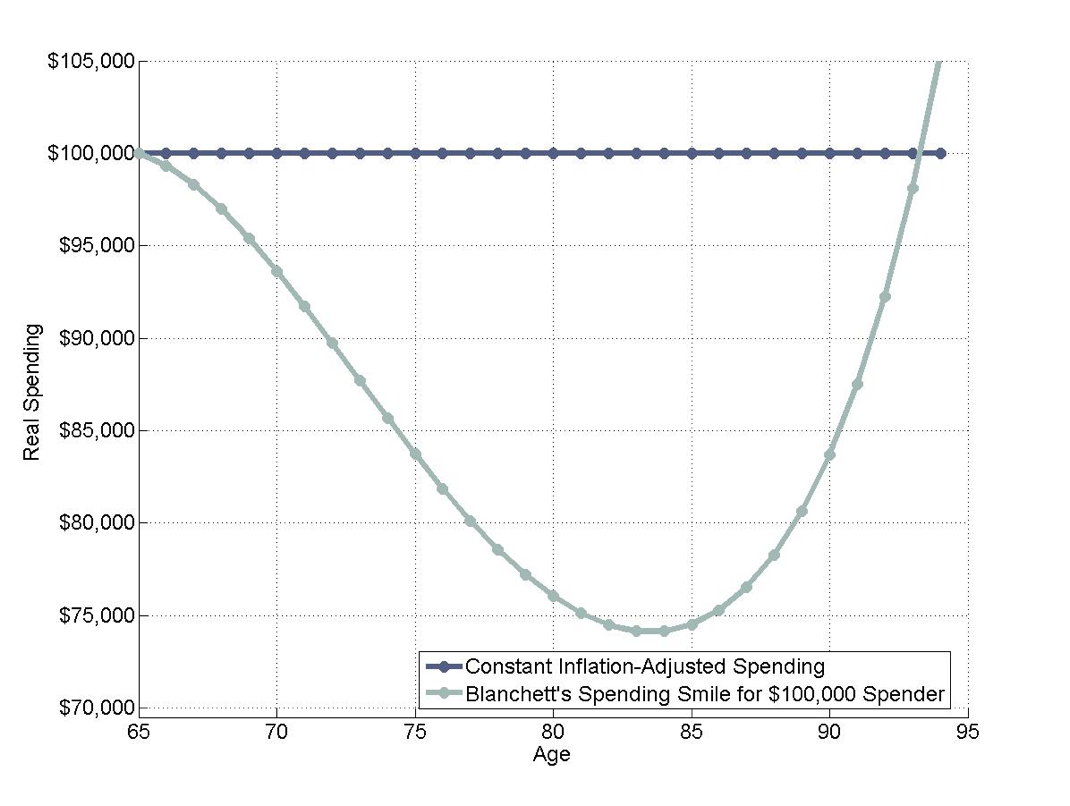
For illustration purposes only. The Estimated Path of Real Retirement Spending for a $100,000 Initial Budget at 65 vs. Constant Inflation-Adjusted Spending Strategy. Based on data from Blanchett, David. 2014. “Exploring the Retirement Consumption Puzzle.” Journal of Financial Planning 27 (5): 34–42
Blanchett observes that the spending smile reflects the same types of outcomes we have described thus far. At the start of retirement, retirees spend more as they enjoy traveling, eating out, and other types of discretionary expenses. As they continue to age, retirees tend to slow down and spend less.
However, while discretionary expenses are declining, health costs tend to rise, and at some point later in retirement, these rising health costs offset reductions in other spending categories. Exhibit 2 provides a further illustration of this process.
Understanding the Path of Real Retirement Spending
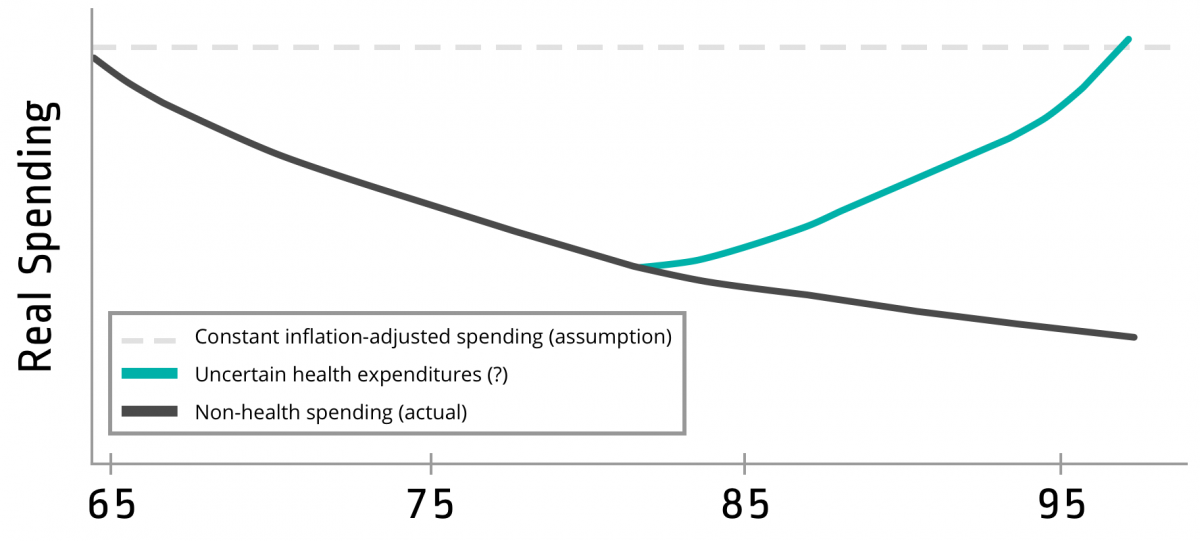
For illustration purposes only.
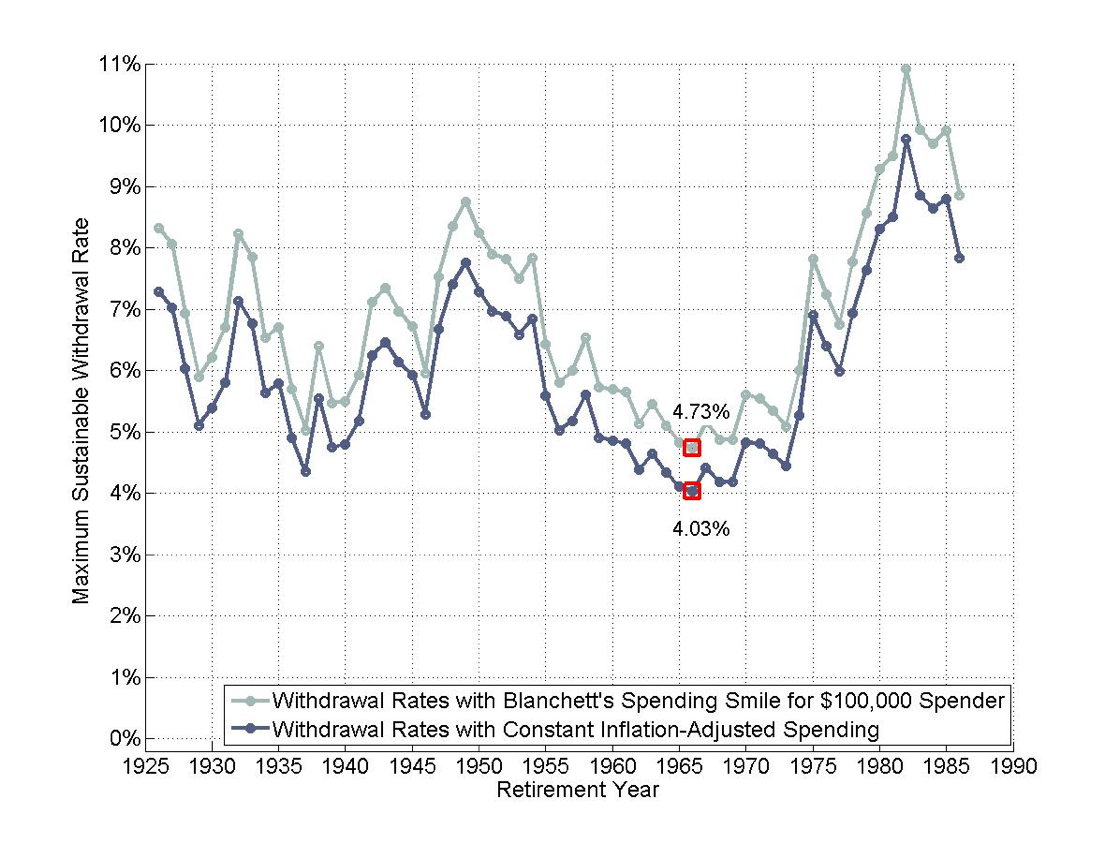
The assumption of constant inflation-adjusted spending, according to Blanchett’s article, will lead individuals to over-save for retirement. The easiest way to understand this is to simply explore historical sustainable spending rates for different retirement spending patterns.
Below, we can see the time path of historical sustainable spending rates for both constant inflation-adjusted spending and the retirement spending smile from earlier. Looking at the constant spending approach over a thirty-year retirement and using a 50/50 portfolio, an initial distribution rate of 4.03% represents the historical worst-case sustainable spending rate from 1926 on. In other words, if you took out 4.03% of your portfolio in the first year of your retirement and then adjusted that amount for inflation for the next thirty years, there were no historical periods where you would have run out of money over the time period of the study. On the other hand, an initial distribution rate of 4.05% would have failed at least once (admittedly, this doesn’t give us much of a guide as to what an optimal distribution rate for our own retirements will be, but it does help us frame the downside risk.)
With the spending smile, the initial spending rate can increase to account for subsequent spending declines. In this case, the worst-case initial spending rate rose to 4.73%, which represents an increase in the initial distribution rate of 17% - just by using a more appropriate retirement spending model. For a retiree basing their spending on these historical worst-case numbers, the retirement smile pattern would allow retirement to begin with almost 15% less accumulated wealth than otherwise.
Blanchett’s Retirement Spending Smile
For illustration purposes only. The Estimated Path of Real Retirement Spending for a $100,000 Initial Budget at 65 vs. Constant Inflation-Adjusted Spending Strategy. Based on data from Blanchett, David. 2014. “Exploring the Retirement Consumption Puzzle.” Journal of Financial Planning 27 (5): 34–42
This makes clear that retirement spending patterns are an important component of deciding on a sustainable spending rate. Constant inflation-adjusted spending is a simplifying and conservative assumption. While we preserve conservative assumptions to aggressive ones, we don’t need to unduly penalize ourselves.
And choosing not to incorporate the retirement spending smile is one of those situations where you could be unduly penalizing yourself – especially if you are planning a distribution rate close to the historical worst-case scenario. Everyone, and every retirement, will be different, but the data around the retirement spending smile is pretty clear. Most people reduce their spending in the middle of their retirement.
McLean Asset Management Corporation (MAMC) is a SEC registered investment adviser. The content of this publication reflects the views of McLean Asset Management Corporation (MAMC) and sources deemed by MAMC to be reliable. There are many different interpretations of investment statistics and many different ideas about how to best use them. Past performance is not indicative of future performance. The information provided is for educational purposes only and does not constitute an offer to sell or a solicitation of an offer to buy or sell securities. There are no warranties, expressed or implied, as to accuracy, completeness, or results obtained from any information on this presentation. Indexes are not available for direct investment. All investments involve risk.
The information throughout this presentation, whether stock quotes, charts, articles, or any other statements regarding market or other financial information, is obtained from sources which we, and our suppliers believe to be reliable, but we do not warrant or guarantee the timeliness or accuracy of this information. Neither our information providers nor we shall be liable for any errors or inaccuracies, regardless of cause, or the lack of timeliness of, or for any delay or interruption in the transmission there of to the user. MAMC only transacts business in states where it is properly registered, or excluded or exempted from registration requirements. It does not provide tax, legal, or accounting advice. The information contained in this presentation does not take into account your particular investment objectives, financial situation, or needs, and you should, in considering this material, discuss your individual circumstances with professionals in those areas before making any decisions.