Occam’s – Inflation and Your Retirement Plan

We’ve been hearing a lot about inflation recently, and for good reason. Inflation rose 8.5% in March compared to a year ago. This is massively higher than we’ve seen in recent (and not so recent) years, and it’s the highest annual inflation rate that we’ve seen since December 1981. Unlike many of the concepts that we talk about with retirement planning, inflation is both very immediate and very concrete. It’s a lot easier to see that your weekly grocery bill has gone up than it is to conceptualize how your risk tolerance might change through time.
For people focused on retirement as this big financial focus, inflation is absolutely something to be thinking about. We often talk about how you are different from the average investor. And one of the classic examples of this is that retirees are generally significantly more exposed to inflation than the average investor. There are a number of reasons for this: you are (or could be soon) spending your savings, your reliable income sources may not be adjusted for inflation (or may only adjust with a significant lag), or you may have a lower ratio of stocks to bonds than other investors (we’ll talk about this one in a bit). But the upshot is that high levels of inflation can put a strain on your retirement income plan.
While we are currently dealing with high levels of inflation, what we really care about from a planning perspective is what inflation will look like out into the future. Luckily, we have a good way to estimate what inflation will be doing in the future.
Using the Market to Estimate Inflation
We can use the market to estimate future inflation. By looking at the difference between the yields on Treasury bonds and the yields on TIPS (Treasury Inflation Protected Securities), the market is telling us what it expects inflation to look like through time.
The logic here is simple. The only meaningful difference between “normal” Treasury bonds and TIPS is the inflation protection built into TIPS, so the difference in price is how much the market is willing to pay to remove inflation risk over the life of the bond. In other words, what the markets think inflation will be during that period.
As an example, let’s say that I want to know what inflation will look like over the next 20 years. I would just compare the two yields – as of when I’m writing this (April 13, 2022), yesterday’s closing rates were 2.99% for the “normal” 20 year Treasury bond, and 0.15% for the 20 year TIPS[1]. Based on these two numbers, I know that the market is predicting that inflation will be around 2.84% per year for the next 20 years.
But we can actually take it one step further, and start taking these annualized numbers apart. Let’s shift gears a bit and think about the next 3 years. Using the same approach as we just used, the annualized inflation over the next three years will be about 3.7%. This is certainly higher than the historical average annual inflation rate (from 1926-2021 the average annual inflation rate was 2.98%[2]), but it’s definitely lower than we are seeing now. What’s going on here?
Well, we can pull this number apart through something called Forward Rates. Essentially, you can think of a three year bond as being equivalent to a series of three one year bonds bought in sequence, or buying a two year bond followed by a one year bond. The bond markets are internally consistent at each individual point in time, so it’s a little bit like algebra. We can shift things around, so long as we aren’t changing the equation. And this opens up all sorts of interesting possibilities. Since we know what the market’s estimate of inflation will be over the next three years (3.7%), and we can get the market’s estimate of inflation over the next two years (4.1%), we can work out what the market expects inflation to do over that third year – it’s basically the rate that makes those two numbers fit together.
The obvious question at this point is how much to trust this approach. Just how good are the predictions being made here? And can you reasonably use them in your retirement income plan? Well, they’re as good as any other estimates made by the market. In other words, they are the aggregate opinion of investors, using all of the available information. We know that they will be wrong (except by chance), but we don’t know if they’re wrong because the estimate is too high or too low. These estimates, just like everything else in the markets, move based on new information – and specifically how that new information squares with what the markets expected to happen. And unless you have some special ability to predict inflation rates – either through access to better information than is available to the market, or being able to analyze that information better than the totality of the market – these estimates are a good starting place.
Notice I said ‘starting place,’ though. From a planning perspective, if you want to be conservative, you can always bump up your assumed inflation rate a bit. Alternatively, you can run multiple different scenarios to see how your plan responds to changing inflation rates and just how sensitive you are to inflation.
Current Inflation Rates
So after all of the logic, what are the markets actually telling us about inflation now? Let’s look at the data.
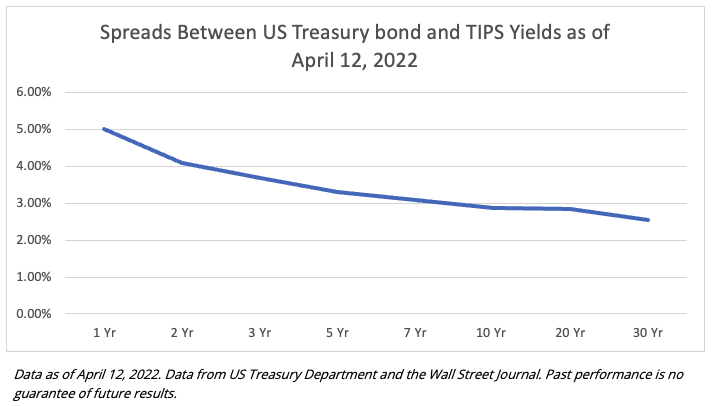
The market is predicting that, based on the currently available information, inflation will be high in the near term, but then come back down towards the historical average. And this trend is even more clear when we use forward rates to look at the year-by-year expected inflation.
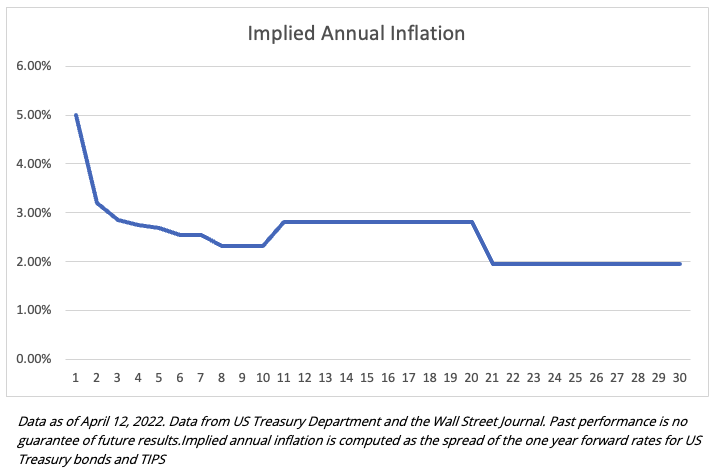
If the market is right, we’re likely to see another year of high inflation (though not quite as high as we’ve seen recently), with future inflation coming back down to Earth relatively quickly. In fact, from year 3 on, the market expects inflation to be below the historical average inflation rate[3].
Using This in Your Retirement Income Plan
All of this is interesting information, but we need to be able to apply it to our retirement income plan for it to be useful. And, as much fun as it would be, using a different inflation rate for each year would be a little unwieldy. As a baseline, you’ll likely want to start with an inflation rate tied to your planning horizon. If you’re 90, you’ll probably be more focused on shorter-term inflation than someone who is in their 60s. From there, you can either use the market’s expected inflation rate, or bump it up to make the analysis more conservative.
Another step that you can take is to run multiple scenarios of your plan and vary the inflation rate (including potentially varying it over time in your plan) to see how that will affect things. While it’s likely that a higher inflation rate isn’t going to do your plan any favors, every plan will respond differently to inflation. Seeing how your results change will help you understand just how exposed to inflation you are.
But how do we go about dealing with this risk? If inflation has a big impact on your retirement income plan, what are some things that you can do to address that? If we focus on the asset side of the equation, I break things into two categories: indirect protection, and direct protection.
Indirect inflation protections are things that are sensitive to inflation and quickly incorporate changes in future expected inflation. While they may not be specifically tracking inflation, these assets (partially) move based on what inflation is likely to do in the future. If the estimate of the five year inflation rate changes, the price of these assets will change, at least to some degree, in response to this. This category, at it’s most broad definition, incorporates pretty much all financial assets, but there are two that I really want to focus on: stocks and short term bonds.
Stocks are great, if incredibly noisy, hedges for inflation. Aside from having higher expected returns (which make up for a lot of sins), there are a couple of different mechanisms that tie stocks to inflation. The most important of these is that inflation is figured into that expected return. In a higher inflation environment, investors demand a higher expected return to hold stocks.
The story is pretty much the same with short term bonds. When bond investors are deciding how much they are willing to pay for a bond (in other words, the cash flows from the bond), they consider how much they think those payments will actually be worth when they receive them. What makes short term bonds special is that frequency with which the portfolio is bringing that information to bear. The bonds held in a short term bond portfolio turn over more quickly than the bonds in a longer term portfolio – and that means that new information about inflation (and everything else) gets absorbed incredibly quickly.
On the direct side are things that are based on actual inflation. These are things like inflation riders on annuities, IPS, or I-bonds. The specifics of annuity inflation riders will depend on the individual contract, and can vary widely, so we’ll put them to the side here (but they can be great tools in the right situation). TIPS and I-bonds are both US Treasury securities. We talked about TIPS earlier, but I-bonds, or more technically Series I Savings Bonds, are essentially the same idea. Their payments change with the actual inflation rate that we are experiencing. When we have higher inflation, their payments increase. TIPS do this by adjusting the principal amount of the bond, and I-bonds do it by including both a base fixed interest rate payment, as well as a variable interest rate payment based on inflation. The big difference between the two is that there are pretty strict limits on the amount of I-bonds that you can buy at once and what accounts you can hold them in, whereas TIPS are marketable securities that are just out there for you to buy and sell as you please. On the other hand, I-bonds tend to pay (much) higher interest rates.
Figuring out how to balance all of the competing demands in your plan is hard. Removing inflation risk from your plan is not free. As you’re thinking about how exposed you are to inflation risk, and how you want to deal with it, you need to keep that cost in mind. And this cost can come in many forms. The costs with direct protection are, well, pretty direct. An insurance company is going to charge you for an inflation rider on your annuity. On average, TIPS will have lower yields than “normal” US Treasury bonds. And they just make I-bonds hard to use. But even with the sources of indirect inflation protection, there are still opportunity costs and tradeoffs to consider. You only have so much space in your portfolio, so it is always a balancing act.
You need to look at your portfolio as a cohesive whole. If you are focused on retirement, inflation is probably a risk that you want to address. But there are other risks that you need to deal with, as well. You need to find the mix of solutions (and risks) that you are comfortable with, and that will help you stay disciplined to your overall retirement income plan.
[1] All Treasury bond and TIPS yields from US Treasury Department and the Wall Street Journal.
[2] Data from Dimensional Fund Advsiors.
[3] From 1926 – 2021 the annual average change in the US CPI was 2.98%.
McLean Asset Management Corporation (MAMC) is a SEC registered investment adviser. The content of this publication reflects the views of McLean Asset Management Corporation (MAMC) and sources deemed by MAMC to be reliable. There are many different interpretations of investment statistics and many different ideas about how to best use them. Past performance is not indicative of future performance. The information provided is for educational purposes only and does not constitute an offer to sell or a solicitation of an offer to buy or sell securities. There are no warranties, expressed or implied, as to accuracy, completeness, or results obtained from any information on this presentation. Indexes are not available for direct investment. All investments involve risk.
The information throughout this presentation, whether stock quotes, charts, articles, or any other statements regarding market or other financial information, is obtained from sources which we, and our suppliers believe to be reliable, but we do not warrant or guarantee the timeliness or accuracy of this information. Neither our information providers nor we shall be liable for any errors or inaccuracies, regardless of cause, or the lack of timeliness of, or for any delay or interruption in the transmission there of to the user. MAMC only transacts business in states where it is properly registered, or excluded or exempted from registration requirements. It does not provide tax, legal, or accounting advice. The information contained in this presentation does not take into account your particular investment objectives, financial situation, or needs, and you should, in considering this material, discuss your individual circumstances with professionals in those areas before making any decisions.