Occam’s – How Buffer Assets Might Be Able to Help Your Retirement

WHAT IS OCCAM’S RAZOR? Occam’s Razor is a principle attributed to William Occam, a 14th century philosopher. He stressed that explanations must not be multiplied beyond what is necessary. Thus, Occam’s Razor is a term used to “shave off” or dismiss superfluous explanations for a given event. This concept is largely ignored within the investment management landscape. This newsletter will “shave off ” popular investment misinformation and present what is important for achieving long-term investment success.
Investing involves risk. When you put your money to work in the financial markets there’s always a chance, over every time period, that you could lose money. Most of the time, especially over longer time frames, the market goes up. But they don’t have to. The risk is always there – and that risk is what investing is about.
But there are things that you can do to control the risk that you are facing (beyond your asset allocation). And one of the simpler things you can do is to use Buffer Assets when you are taking money out of your portfolio.
What are Buffer Assets?
Buffer assets are exactly what they sound like. They are very low-risk assets that are largely uncorrelated with your investment portfolio that serve as a buffer between the vicissitudes of the market and your spending. Some typical examples of buffer assets are things like a line of credit from a reverse mortgage, the cash value of a whole life insurance policy, or just plain cash. Essentially, buffer assets allow you to control when you need to sell volatile (and higher returning) assets from your portfolio to fund your spending. They are there to help manage your sequence of returns risk.
In the “perfect” world of an intro to investing class, the sequence of your returns doesn’t matter. So long as you aren’t putting any money into, or taking money out of your portfolio, it doesn’t matter how the returns you experience are arranged – it all just goes into the portfolio’s total return equally. But that first part, that no money is going into or out of your portfolio, doesn’t usually hold. For most of us, we’re either actively saving money into our investment portfolio while we are working (hopefully), or we are spending out of that portfolio after we are retired. When we add those cashflows into the mix, the order that we experience returns matters.
Normally, this is where we start taking about how your sequence of returns risk is highest right around retirement (or more specifically when you start taking distributions from your portfolio). That’s often the point when your portfolio is the largest, and you are locking in any losses (or gains) when you take money out. And this is absolutely true.
But I want to highlight an important corollary – in retirement, your sequence of returns risk is always decreasing. This year’s returns will have a greater impact on the likelihood that you’ll be able to meet your planned spending throughout your life, than any other year in the future. In other words, this year’s return is always the most important one.
Ideally, we would want to avoid selling when the market is down to minimize our sequence of returns risk. This is where buffer assets can help.
How Buffer Assets Can Help Manage Sequence of Returns Risk
Buffer assets can help mitigate sequence of returns risk by separating your spending from when you need to sell assets from your investment portfolio – at least to a point. There are two main approaches for how to do this.
The first approach is to treat your buffer assets as essentially reserves. With this approach, you keep a big pool of money off to the side that you can spend from in the years when your portfolio is down (or below some specific return). This approach is pretty straightforward, but it does require a lot of assets to be held in reserve at the front end.
The second approach is to use your buffer assets more as working capital. You have a (smaller) pool of money that you do all of your spending from – whether the market is having a good year or not – and you refill that pool whenever it is advantageous.
So, for instance, say that I am using this approach and I have enough buffer assets to cover three years of spending. During the first year, I’ll take my distributions from my buffer assets, and then at the end of the year I’ll look to see how my portfolio performed. If the markets cooperated, I’ll sell enough risky assets to bring my buffer assets back up to 3 years of spending. But if the markets had a bad year, I wouldn’t do anything. Next year I’ll continue to eat into my buffer. Then at the end of the year, I’ll look at my returns again and see if the market has recovered. If it has, I can start building back up my buffer. You’re essentially building a runway for your spending.
While buffer assets are a great tool for managing your sequence risk, there’s always a tradeoff. Holding buffer assets means that you are holding money back from your investment portfolio. You need to consider whether reducing your exposure to sequence risk is worth reducing the potential upside from your investment portfolio.
How Big of a Buffer Do You Need?
If you do decide to use buffer assets, you need to think about how big of a buffer you need. The bigger your buffer – the longer you can go without selling from your investment portfolio – the more you protect yourself against sequence of returns risk – but the more potential growth you give up.
One way to figure out how big of a buffer you may want to use is to look at the historical data.
If you are thinking about the first approach to buffer assets that we discussed – keeping a big pile of money on the side to spend through when the market is down – you’ll want to be thinking about how many years the market will be down during your retirement. If you are going with the second approach – keeping a smaller buffer that you spend from and replenish, you’ll want to be thinking about how long downturns typically last.
So let’s start with the first question: during a “typical” retirement, how often will the markets lose money over the course of a year? To keep our analysis simple (and essentially the worst case), let’s look at the annual returns of the S&P 500 Index from 1926 through 2021. What we want to know is, stepping through each year, how many years has the S&P 500 Index gone down over either a 30 or 40 year retirement? The more years with a negative return, the more years you’ll be tapping your buffer assets, and the bigger buffer you’ll need.
So what are the numbers? Let’s start with the summary.
| 30 Year Retirement | 40 Year Retirement | |
| Average number of negative years | 7.3 years | 9.8 years |
| Standard Deviation | 1.7 years | 2.0 years |
| Maximum number of negative years | 12 years | 14 years |
| Minimum number of negative years | 5 years | 6 years |
For both lengths of retirement, we see that the S&P 500 has been down a little less than a quarter of the time, though the right (bad) tail does get a little bit ugly. But let’s look at the frequency of the outcomes as well.
Number of Negative Years over a 30-Year Retirement
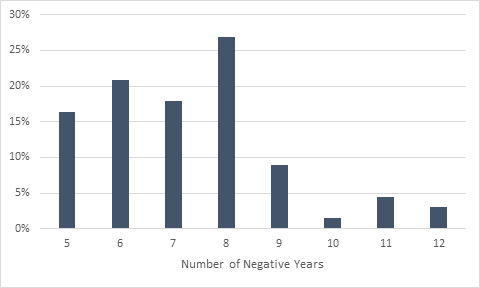
Number of Negative Years over a 30-Year Retirement
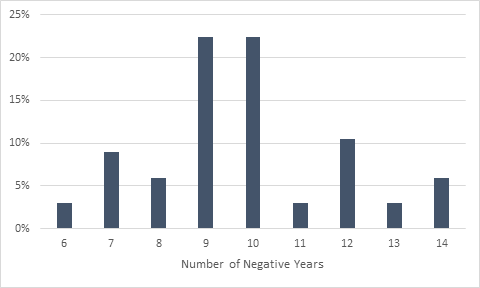
Most of the outcomes for both retirement lengths are right around the averages (as you would expect), but there are definitely some bad outcomes. It is worth pointing out that most of the really bad outcomes center around the Great Depression. Using the 30-year retirement, no one retiring after 1931 had more than 9 negative years, and no one retiring after 1952 had more than 8 negative years over the course of their retirement.
I’m always wary of discounting data from the Great Depression – it happened – but as we think about what is likely to happen in the future, it’s important to consider how likely we are to see a situation like that again. It can definitely happen, but the financial markets (and the world) are a very different place than they were a century ago.
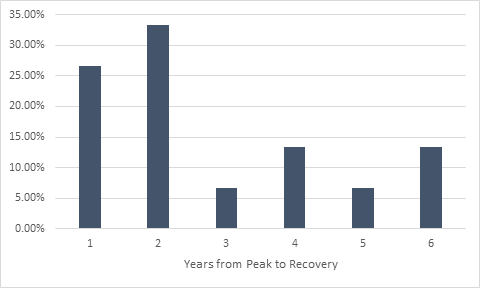
Let’s take up the case where you spend out of your buffer assets and then refill them when you can avoid selling things at a loss. With this approach, we don’t care (as much) about how often the market declines, instead, we care about how long the market takes to get back to its initial peak (encompassing both the decline and recovery).
This time around, we’ll continue looking at the S&P 500 Index, but we’ll be using monthly data to get a little more specificity. We’ll want to focus on periods where the markets saw a reasonable decline, so we’re looking for a drop of 10% or more from peak to trough.
Over the period we’re looking at, there were 15 periods that met our criteria. And they cover a whole lot of ground and different situations. Going back to the example we used before, the Great Depression took 185 months (15 years and 5 months) to get back to its peak in September 1929. On the other hand, at the beginning of the pandemic, the market declined and rebounded back to its initial high in only 7 months.
On average, it took a little more than 37 months for the market to drop and then recover to its initial level. Though if you exclude the Great Depression, it only took 26.5 months on average. My previous comment about the applicability of data from the Great Depression still stands, but it is the clear outlier here at 185 months from peak to recovery. The Tech Crash, which was the next longest period, “only” took 74 months from peak to recovery.
Overall, most downturns are relatively short. 60% of downturns recover in two years or less, and two-thirds recovered by the end of year 3.
How Big of a Buffer Do You Want?
While playing with the numbers is fun, we want to use what’s happened in the past to inform what we will do going forward. You probably don’t want to (and aren’t able to) stash away 15 years of spending in your buffer assets. So the question becomes how big of a buffer you do want to build into your plan (if any at all)? How long of a runway do you want to have where you can ignore whatever the markets are doing?
Like most planning questions, there is no right answer. It comes down to what you want to do. You need to decide on the size that you feel comfortable with – balancing the benefit of reducing your sequence of returns risk against the cost of reducing the potential upside of your investment portfolio’s growth.
Buffer assets can be a great tool, and there is evidence that they can improve overall outcomes in the right situations, but they aren’t a panacea. They aren’t necessarily for everyone. It always comes down to what makes sense to you – what are the tradeoffs that you want to make in your retirement income plan?
McLean Asset Management Corporation (MAMC) is a SEC registered investment adviser. The content of this publication reflects the views of McLean Asset Management Corporation (MAMC) and sources deemed by MAMC to be reliable. There are many different interpretations of investment statistics and many different ideas about how to best use them. Past performance is not indicative of future performance. The information provided is for educational purposes only and does not constitute an offer to sell or a solicitation of an offer to buy or sell securities. There are no warranties, expressed or implied, as to accuracy, completeness, or results obtained from any information on this presentation. Indexes are not available for direct investment. All investments involve risk.
The information throughout this presentation, whether stock quotes, charts, articles, or any other statements regarding market or other financial information, is obtained from sources which we, and our suppliers believe to be reliable, but we do not warrant or guarantee the timeliness or accuracy of this information. Neither our information providers nor we shall be liable for any errors or inaccuracies, regardless of cause, or the lack of timeliness of, or for any delay or interruption in the transmission there of to the user. MAMC only transacts business in states where it is properly registered, or excluded or exempted from registration requirements. It does not provide tax, legal, or accounting advice. The information contained in this presentation does not take into account your particular investment objectives, financial situation, or needs, and you should, in considering this material, discuss your individual circumstances with professionals in those areas before making any decisions.