A second approach to studying retirement withdrawal rates is to use Monte Carlo simulations which are parameterized to the same historical data as used in historical simulations. This can be done either by randomly drawing past returns from the historical data to construct 30-year sequences of returns in a process known as bootstrapping, or by simulating returns from a distribution (usually a normal or lognormal distribution) that matches the historical parameters for asset returns, standard deviations, and correlations. The relevant characteristics of the historical data used in typical Monte Carlo simulation studies are provided in Table 2.2.
|
Table 2.2
|
|
Summary Statistics for U.S. Real Returns Data, 1926 – 2010
|
|
|
|
|
Correlation Coefficients
|
|
Arithmetic
Means
|
Geometric Means
|
Standard Deviations
|
Stocks
|
Bonds
|
Bills
|
|
Stocks
|
8.70%
|
6.62%
|
20.39%
|
1
|
0.08
|
0.09
|
|
Bonds
|
2.52%
|
2.28%
|
6.84%
|
0.08
|
1
|
0.71
|
|
Bills
|
0.69%
|
0.61%
|
3.90%
|
0.09
|
0.71
|
1
|
|
Source: Own calculations from Stocks, Bonds, Bills, and Inflation data provided by Morningstar and Ibbotson Associates. The U.S. S&P 500 index represents the stock market, intermediate-term U.S. government bonds represent the bond market, and bills are U.S. 30-day Treasury bills.
|
A downside of Monte Carlo simulations is that they do not reflect other characteristics of the historical data that are not incorporated into the assumptions, such as the possibility of serial correlation in returns, or the possibility of mean reversion guided by market valuations. Another downside is that the results of Monte Carlo simulations are only as good as the input assumptions, though when thinking about future retirements, historical simulations are likely to be even more disadvantaged by this issue. See “Lower Future Returns and Safe Withdrawal Rates” for more on this. Overall, the advantages of Monte Carlo simulations likely more than make up for any deficiencies with respect to historical simulations.
Monte Carlo simulation has the advantage of allowing for a wider variety of scenarios than the rather limited historical data can provide. Between 1926 and 2010, there are only 56 rolling 30-year periods. And as is about to be discussed, these 56 periods are not independent of one another. Meanwhile, it is not uncommon to see a Monte Carlo simulation study based on 10,000 simulated paths of financial market returns. This provides an opportunity to observe a much wider variety of return sequences that support a deeper perspective about possible retirement planning outcomes than can be provided with the limited historical data.
Another advantage of Monte Carlo simulations, relative to historical simulations, is that because of the way that overlapping periods are formed with historical simulations, the middle part of the historical record plays an overly important role in the analysis. With data since 1926 and for 30-year retirement durations, 1926 appears in one rolling historical simulation, while 1927 appears in two (for the 1926 and 1927 retirees). This pattern continues until 1955, which appears in 30 simulations (the last year for the 1926 retiree through the first year for the 1955 retiree). The years 1955 through 1981 all appear in 30 simulated retirements. Then a decline occurs as 1982 appears in 29 simulations, through 2010 which only appears in one simulation (as the final year of retirement for the 1981 retiree). This overweighted portion (1955-1981) of the data tends to coincide with a severe bear market for bonds. During these years, the real arithmetic return on intermediate-term government bonds was -0.1%, compared to an average of 3.7% for the combined years prior to 1955 and subsequent to 1981. The differences are even more severe for long-term government and corporate bonds.
On the other hand, Monte Carlo simulations treat each data point equally. The middle years do not play a disproportionate role in determining outcomes. As a result of this discrepancy, a point highlighted particularly well by Dick Purcell (who just started a website on investor education) in the “Trinity Study Authors update their results”discussion thread at the Bogleheads Forum, Monte Carlo simulations of the 4% rule based on the same underlying data as historical simulations tend to show: (1) greater relative success for bond-heavy strategies, (2) less relative success for stock-heavy strategies, and (3) lower optimal stock allocations.
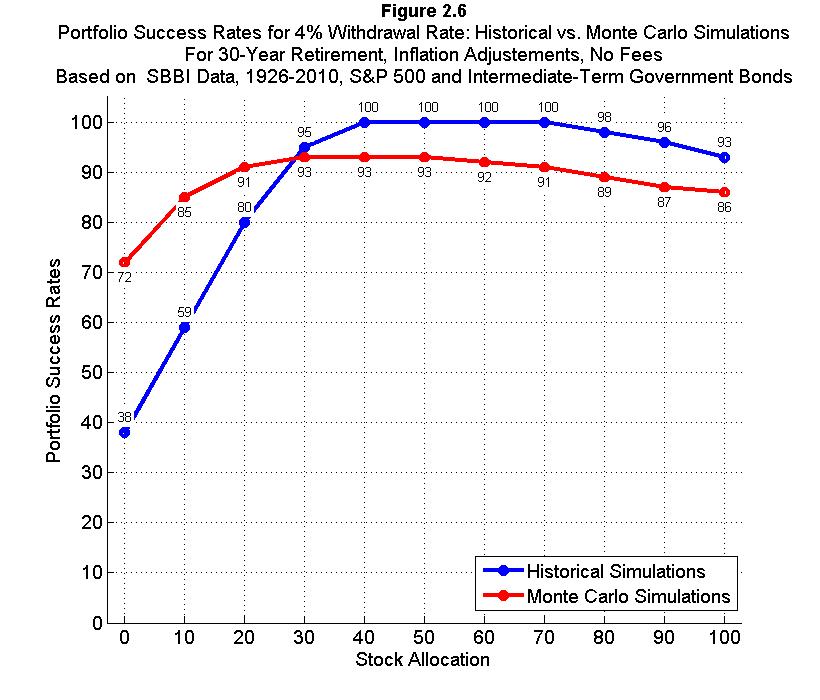
Figure 2.6 provides specific results, comparing the portfolio success rates for varying asset allocations when using a 4% withdrawal rate. When using intermediate-term government bonds, 4% withdrawals did not fail over 30 years in the historical data for stock allocations between 40 and 70 percent. More bond-heavy portfolios experienced much lower success rates, though, with a bonds-only portfolio providing success in 38% of the historical simulations. Such results may scare retirees into holding more stocks than justified by their risk tolerance or by reality. This is especially the case as historical simulations may also induce overconfidence about the potential success of stock-heavy portfolios. With Monte Carlo simulations based on the same historical data, retirees would be encouraged to hold some stocks, but success rates of over 90 percent are possible with stock allocations of only 20 percent. The highest success rates occur in the range between 30 and 50 percent stocks.